Cart Pixel launch on Storefront
Cart Pixel has officially launched on Storefront! Over 200 brands now have Cart Pixel deployed on their Storefront sites.
What is Cart Pixel?
CartPixel offers customer behavior tracking to give brands a holistic view of the entire buyer journey, across all of their shopping and marketing channels. Most big-box companies use the last interaction in a customer journey to guide their marketing strategy and analytics. This ignores the complexity of the many touch points a brand has with a customer throughout their journey.
CartPixel’s AI-powered, multi-touch attribution model helps brands understand how much each interaction in the customer journey contributes to conversions. The end result? Customers can focus their marketing dollars on the root causes of conversion, not just the last interaction.
Cart Pixel integration with Shopify
Cart Pixel now integrates with Shopify storefronts. With this integration, brands that use Shopify for their online stores can leverage the full capability of Cart Pixel with both their storefront and marketing data to optimize marketing spend and boost ROAS.
New marketing intelligence dashboards in Unified Analytics
Unified Analytics has two added dashboard views to help brands better understand and action on their marketing data.
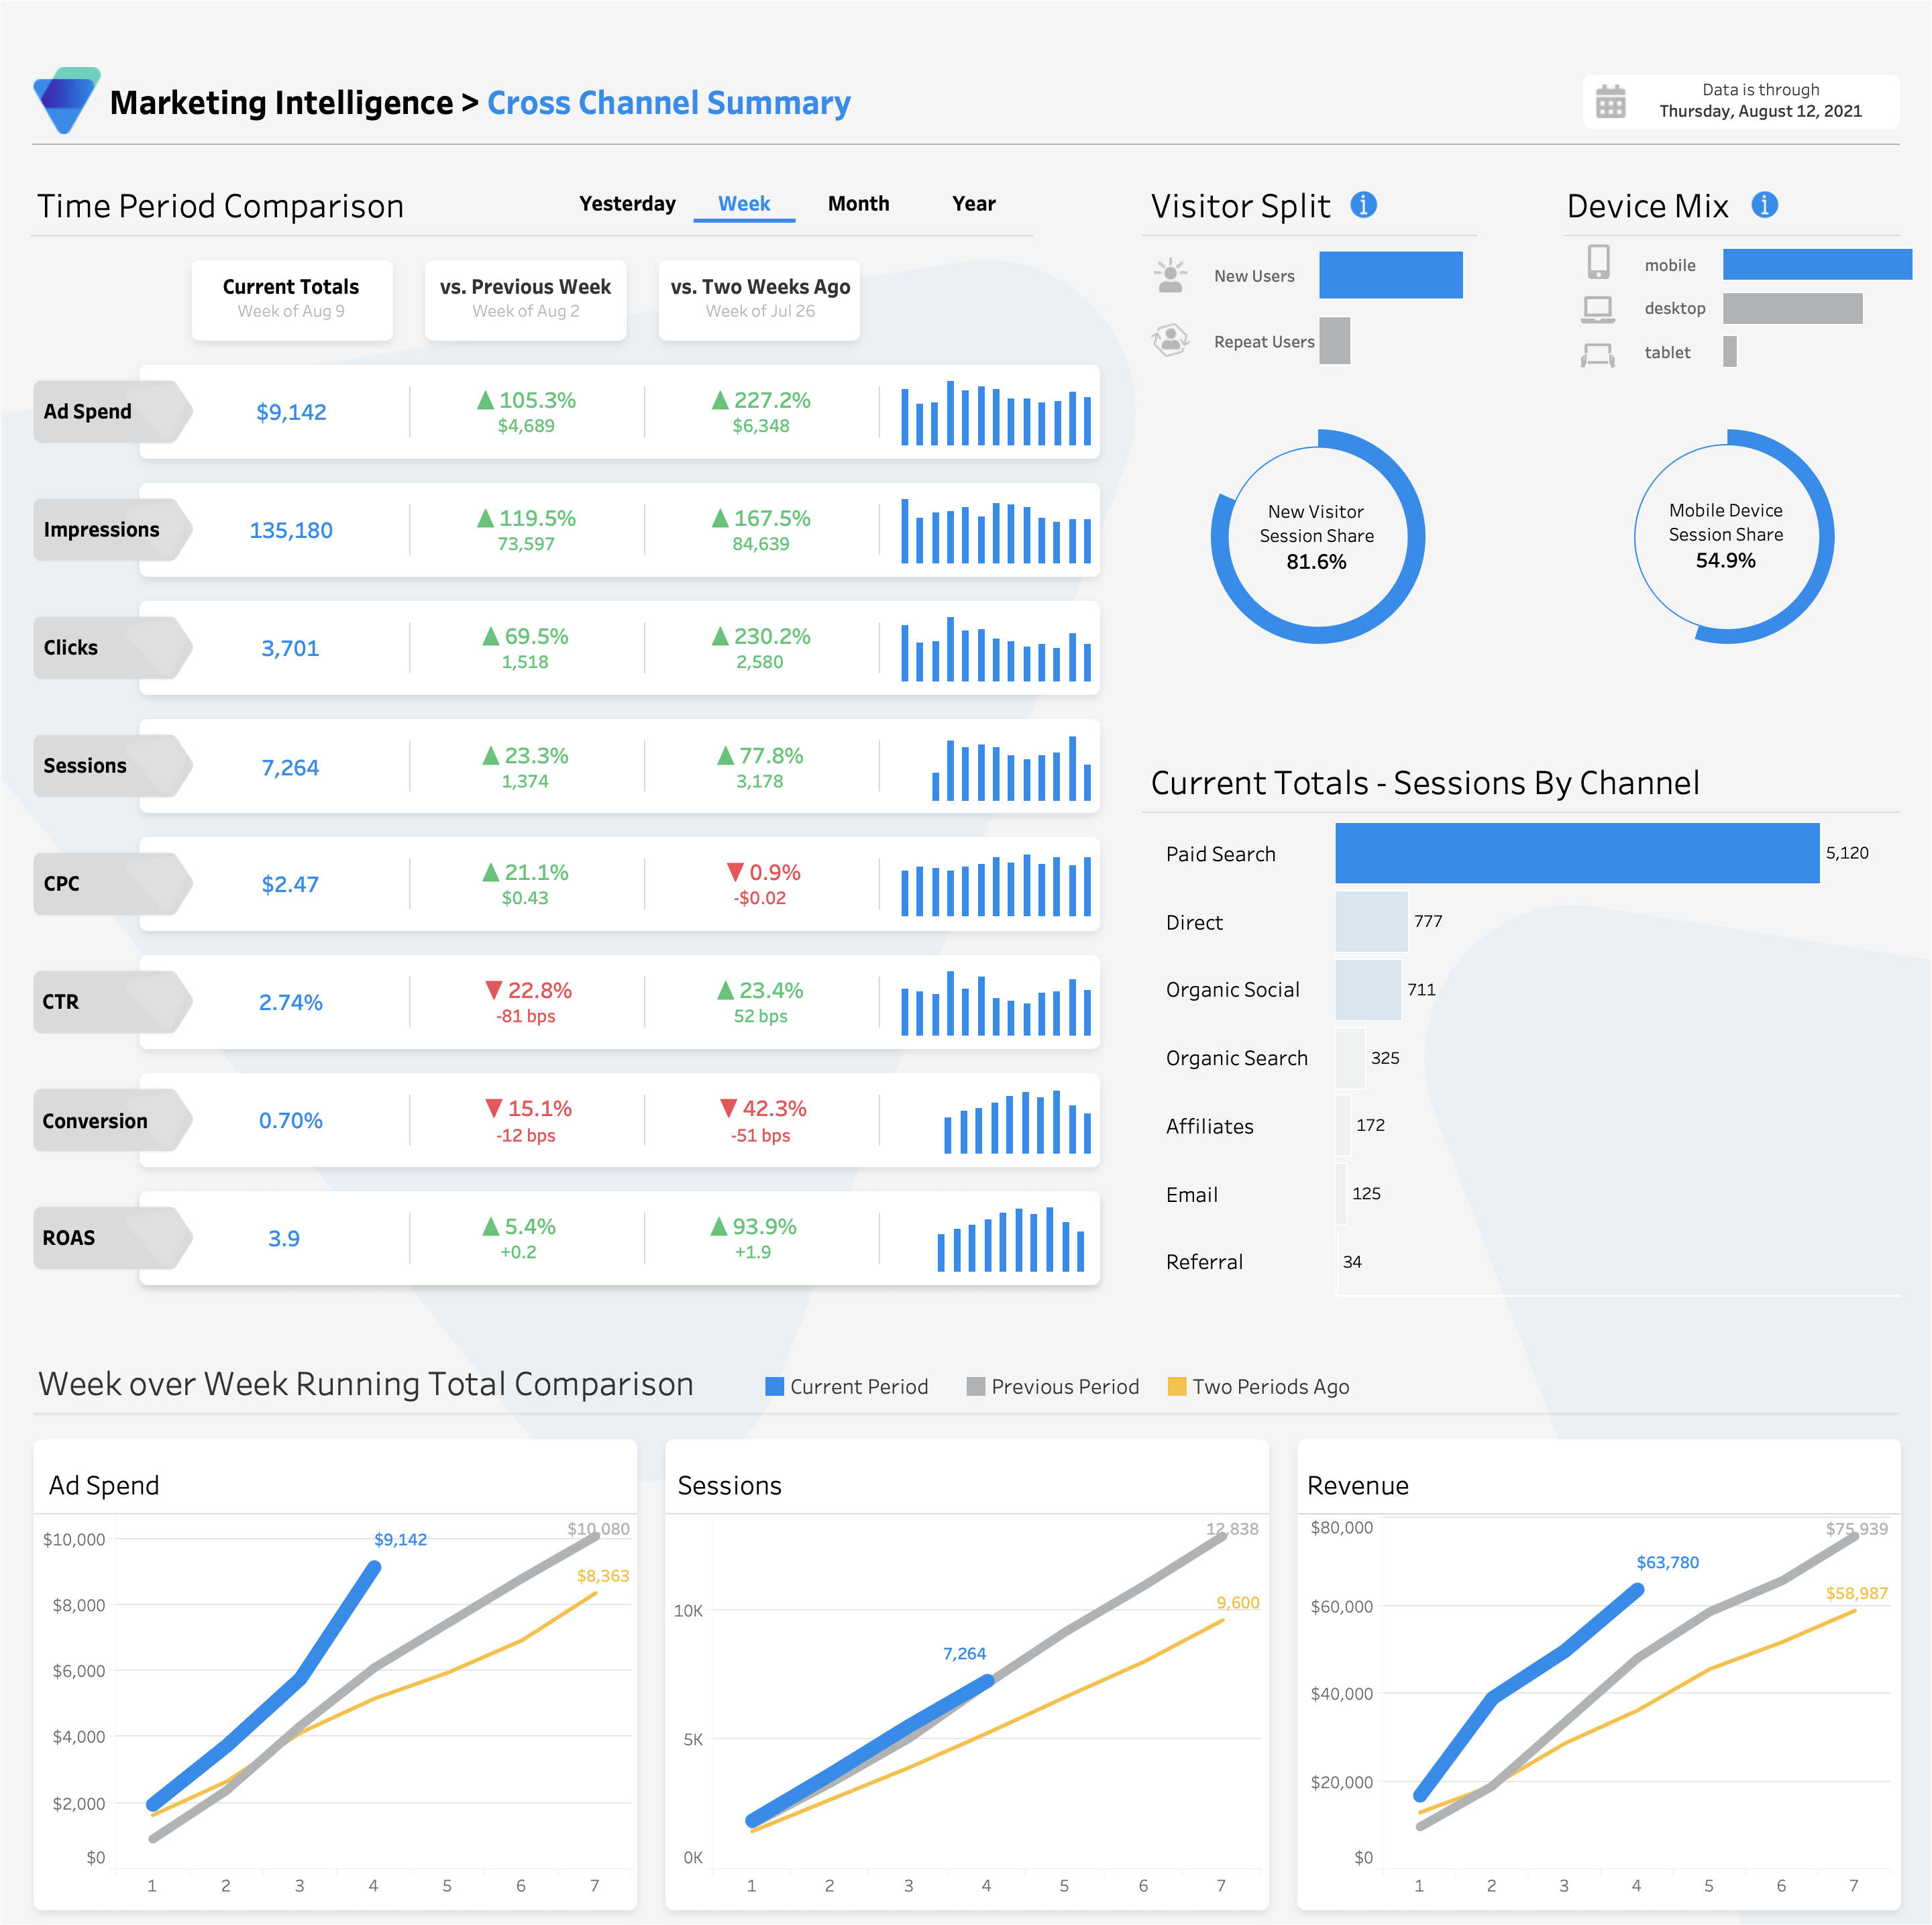
1. Marketing Intelligence Overview Dashboard
The new MarketingIntelligence Overview Dashboard gives brands a single, easily accessible place to view the most important metrics for attracting customers. They can see marketing spend and performance trends over time for specific channels or in aggregate as well as an overview of visitor and session information.
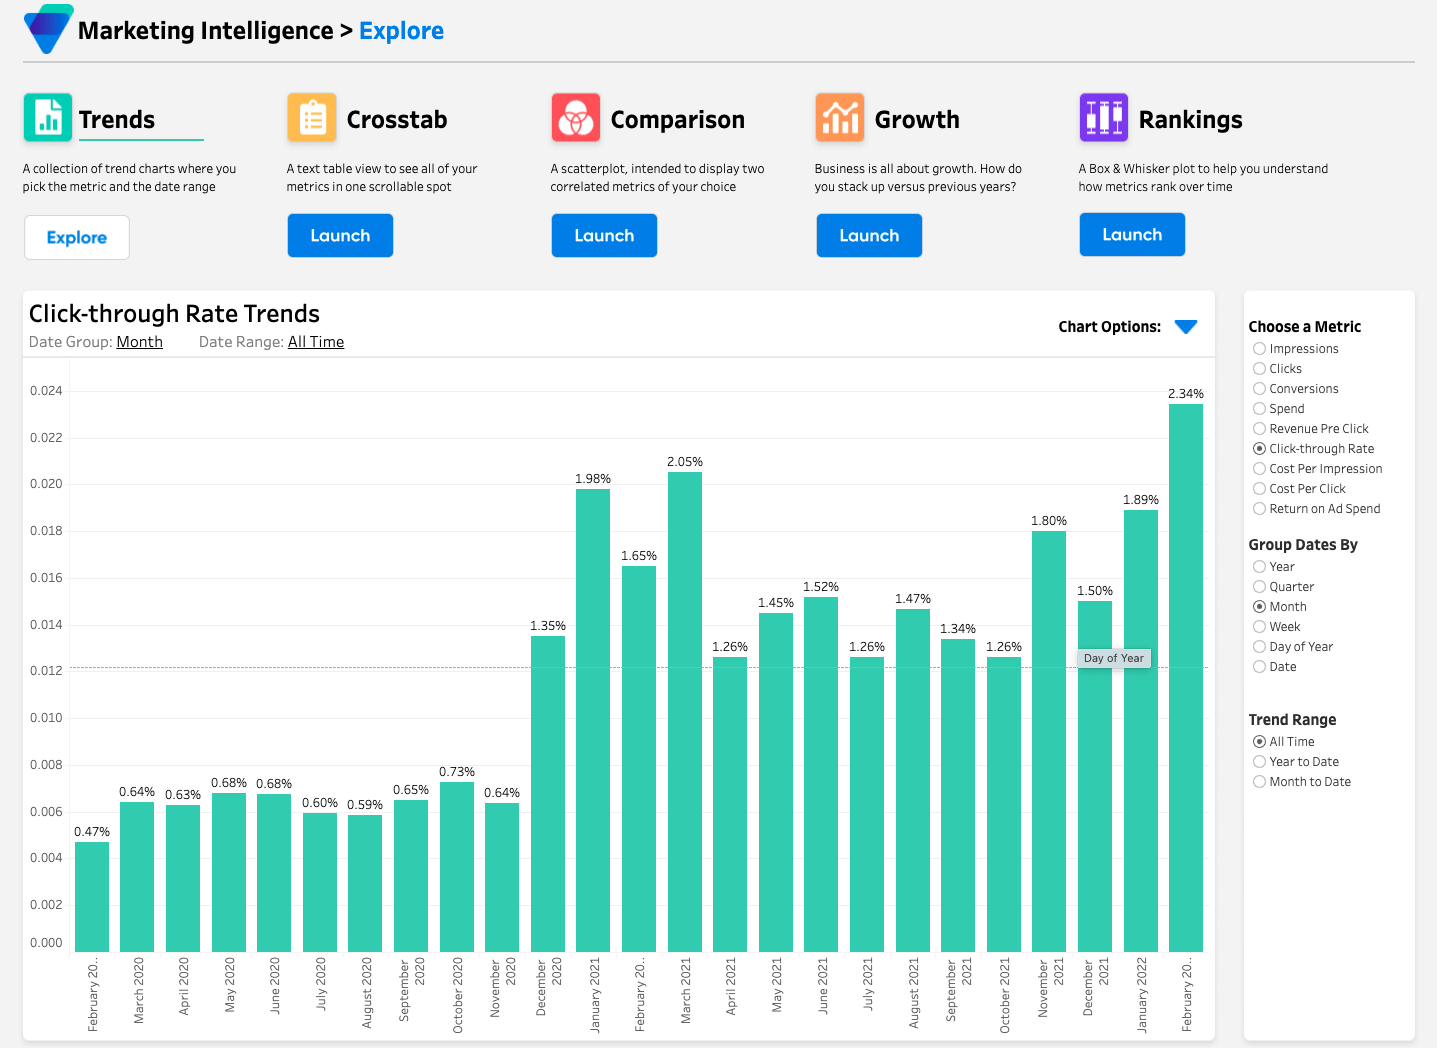
2. Marketing Intelligence Explore Dashboard
The MarketingIntelligence Explore dashboard presents brands with a self-service interface to slice, plot and export their marketing metrics.
- Trends: A collection of trend charts where customers can pick the metric and date range.
- Crosstab: A filterable text table with all metrics in one scrollable and easily exportable location.
- Comparison: A scatterplot with correlated metrics of the customer’s choice.
- Rankings: A box and whisker plot to help customers understand how metrics rank over time.