What is ecommerce analytics?
Ecommerce analytics is the process of finding and communicating shopping and other web based behavior patterns in online businesses, and with 30 percent of the global population now shopping online that can be quite the task.
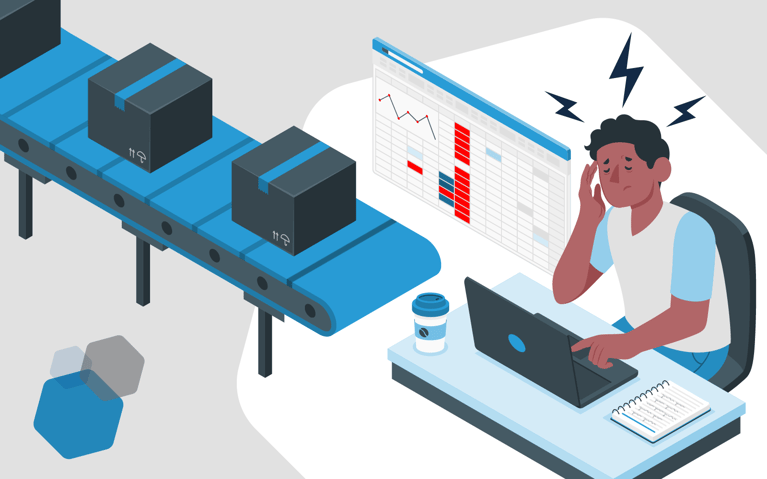
Marketers rely on data to show returns, or return on investment (ROI), for campaigns they are running and media expenses they've made. Data visibility is crucial a part of clear communication; the goal is to boost sales and to the find story the data is telling. When a data collection platform is working as it should, it can also predict what will happen next.
Marketers and other digitally driven departments have to make decisions at a micro and macro level, and ecommerce analytics, at its best, can drive strategy setting the course for standard operating procedures and automation for the following priorities:
- Purchasing trends
- Marketplace vs online store trends
- Feature metrics and behavior patterns
- Strategy and channel efficacy
- Resource allocation
- Profit maximization
Why ecommerce analytics should be top of mind
Without actionable data, business owners will find making smart decisions is difficult at best, reckless at worst. It’s all about knowing and understanding your business, by the numbers, and relying less on instincts or anecdotal feedback from a handful of customers. Before the inevitable tool debate begins, it’s important you and your team agree on what metrics are critical for success.
Below is a list of standard questions all online brands should be able to answer with their data:
- Where do customers come from?
Channels are a big deal. Visibility into where your audiences spend (and are likely to keep spending) is a given. Without that visibility, you’re flying blind.
- What channels bring the most valuable customers?
The value of certain types of customers is also important and should tie back to your personas or ideal customer profiles in b2b sales. We live in a subscription economy, where people continue to pay for your service year after year. In ecommerce, the same notion holds true, but we call it “brand loyalty.”
- What cohorts have the highest lifetime value (LTV)?
Figuring out the average order value of your customers over a long period of time may be daunting at first, but most companies start with industry benchmarks and refine as they learn more.
Ultimately, you can take that LTV number and calculate how much it costs to get a customer to buy from you, known as customer acquisition. The formula for that is called LTV:CAC, or Lifetime Value:Customer Acquisition Cost. It tends to be more of a B2B metric, but it’s a universally valuable indicator of profitability.
There are other metrics marketers rely on to refine their strategies. Those key performance indicators (KPIs) are north stars for many marketing organizations and access to those metrics is almost as critical.
Leveraging the wide array of KPIs requires a little education, but ultimately, it’s a critical step in understanding what’s working for business owners, their brand, and their products, and where there might be room for improvement.
Here are the most important ecommerce analytics KPIs:
- Discovery Rate
Discovery refers to the number of people who find your website for the first time. It can also provide visibility into the channel preference. Budgets should be based on channel efficacy. Whether it’s paid search or social media advertising, the money would be where the opportunities are.
Simply put, discovery rate can help you determine which traffic sources (and devices) are most effective at driving conversions and customer acquisition.
Discovery rate is very similar to penetration rate or click through rate (CTR), in that it measures action divided by impressions or times your products appeared on someone’s search, feed, or inbox.
- Acquisition Rate
Acquisition rate is the total number of people who became customers divided by the total audience, or the people who completed the “action” that dropped them into your funnel, the guiding metric of customer acquisition.
- Conversion Rate
Conversion rate and acquisition rate can often mean the same thing, but conversion rate tends to be subjective, while acquisition has stricter criteria, more so with an ecommerce business than a B2B. It all boils down to what you want the customer to be doing, that specific goal associated with your campaign. You take that number in aggregate (maybe it’s completing a customer survey) and dividing it by the total audience in that campaign (maybe the number of email addresses in your email blast).
- Customer retention rate
Retention is the percentage of customers who come back after their first purchase, making it stronger indicator of longterm customer value than conversion rate. It's an important indicator of customer satisfaction, and it can also tell you how satisfied customers are with your customer experience initiatives, like loyalty programs and email marketing. If a high percentage of your customers return for more purchases, you're probably doing something right. If not, it's time to rethink things.
- Word-of-mouth
Generating a lot of word-of-mouth advertising (also known as an advocacy rate) is not just about your customers liking you and what you do, it’s also about your brand being part of a rich conversation.
You can measure this tricky metric by looking at how many people are mentioning your brand online using social media or other platforms, like blogs or forums, and then you can make assumptions about non-trackable conversations based on industry benchmarks. You can also get an idea of how many people are talking about your brand in offline conversations by using tools like Google Alerts.
Advocacy is a key indicator of success for ecommerce businesses. A high advocacy rate shows that your customers are happy with your product and that they're telling their friends about it, which means you're likely to see an increase in sales as well.
The role of Google Analytics in ecommerce analytics
Google Analytics is a legacy tool that allows you to view your website's statistics, engagement, and traffic. For many it’s the default access tool for traffic trends and customer insight. It's important to incorporate Google Analytics into your stack because data from different sources can tell different stories. Having a baseline is critical, and it can help you troubleshoot discrepancies. You can also track user engagement with different aspects of your site, like:
- Pages per session
- Conversion rate
- Time on site
- Geographic data
- Online interests
By setting up goals for your online store, you are establishing conversion actions that can steer your UX and advertising decisions.
You can also determine which pages drive the most traffic. What people are searching for when they come to your site is an important indicator of intent and shopping behavior.
Google Analytics tracks other valuable information about visitors who come to your website, including:
- Bounce rate: Bounce rate records the number of people leaving after viewing only one page. A high bounce rate could mean there's something wrong with your content or layout.
- Returning visitors: Understanding who is returning to your site or campaigns and how they’re interacting with your content can steer conversations around advertising campaigns and budget allocation, meaning you should prioritize strategies that bring new visitors in without losing existing ones.
- Top pages: The top pages section shows you where most of your traffic comes from. If most people are clicking on one page, that's probably a good place to focus some extra attention and resources on.
- Traffic sources: This helps you find out what kinds of channels are driving customers to your site so that you can focus on those channels in the future. For example, if social media is driving a lot of traffic but not converting into sales, maybe it's time to stop spending time on Twitter and Facebook and shift focus elsewhere.
Customer behavior and ecommerce analytics examples
The main goal of ecommerce analytics tools is to understand and improve the performance of your online store. It’s all about selling products at the end of the day, and the data you collect on user behavior, product performance, and marketing campaigns helps you understand how well your store is performing and what improvements you can make.
For instance, user behavior data includes information about how people interact with your website, as well as their general online browsing habits, emphasis on “general,” but you can use this information to understand your existing customers better, and also to get a deeper understanding of customers yet to try your products. Identifying that opportunity is critical when launching new marketing efforts.
What are the most popular uses for ecommerce analytics?
There are many “use cases” for ecommerce analytics tools, depending on who you ask, but typically uses fall into one of two big categories:
- Marketing-Related Data: Marketing-related data typically consists of sales promotions, email campaigns, and other ongoing programs that are designed to increase sales or traffic on your site. With it, you can drill down into performance on promotions, email campaigns, social media ads, paid search, SEO, and other programmatic endeavors. It’s also a great way to showcase acquisition cost and investment (ROI)—because the bottomline will dominate most analytics discussion if you don’t clearly communicate it. Marketing analytics has even deeper, more valuable, subsets: descriptive, predictive and prescriptive analytics:
- Descriptive analytics: considered the most basic, descriptive analytics leverages simple math and average order value, with a focus on incremental percentage changes. It’s accessible but not as actionable as predictive and prescriptive analytics.
- Predictive analytics: using the rules of probability, predictive analytics relies on statistical modeling and machine learning algorithms like regression and clustering. It’s used for forecasting primarily.
- Prescriptive analytics: after considering the possible implications of each decision option, prescriptive analytics recommends decisions that will best take advantage of future opportunities or mitigate future risks.
- Product-Related Data: Product-related data usually includes information on product popularity and inventory, but there are tools out there with some serious “predictive” power.
Some ecommerce platforms, like Cart.com, can help with inventory management as a part of the entire customer journey and show you how to start your ecommerce business. Successful ecommerce brands use Cart’s next-generation data science capabilities to harmonize data across multiple sources to provide you critical insights. With Unified Analytics, we can identify potential gaps in inventory or areas where you need to improve your product descriptions or images in order to boost sales.
How is Cart.com’s analytics platform different?
Our analytics platform, like any free Google Analytics account, is a fully turnkey solution. We understand most brands don’t have the resources to build an in-house analytics engine. We do the heavy lifting, so brands can focus on creating value for their customers.
Cart.com’s Unified Analytics Suite has all the performance metrics you would expect from an enterprise platform, plus smarter data features that give you an edge over competitors. Here’s how cart.com gets your data working for you:
Attract new customers with:
- Cart Pixel
- ML-Based Attribution
- Optimize Campaigns
- Adjust Ad Spend
Convert window shoppers by:
- Increasing conversions
- Improving product sales
- Increasing units per order
- Identifying sales trends and anomalies
- Identifying operations trends
Simply your workload by:
- Automatically responding to operations trends
- Optimizing your inventory real time
- Incrementally reducing your operational costs
Cart’s Unified Analytics automatically collects and harmonizes the data that makes up each shopper’s journey. We give brands the power to understand what works, what doesn’t, and what could work even better—more specifically, those must-have metrics mentioned a few paragraphs back:
- Lifetime value (LTV)
- Channel performance
- Conversion rates by channel
- User experience and website design performance
- Product performance
Unified Analytics makes it easy for brands to access the “what, why, and how much” questions that dominate meetings, and we do it at less than 1/10 the cost of other enterprise platforms. Not only is it cost effective, customers typically recoup that cost in sales boosts almost immediately.
How good ecommerce analytics tools take the guessing game out advertising return on investment (ROI)
Cart.com’s ecommerce analytics suite maximizes return on advertising spending (ROAS), and adds a layer of predictive insight, unlike Google Analytics, revealing how your customers are interacting with your brand, and how your ad spend informs the budget and targeting decisions you make.
ROAS is about maximizing profit, a fact every digital marketing manager is well aware of, but that’s not necessarily apparent to those just dipping their toes into the wild world of online advertising. By ensuring that every dollar spent on ads or marketing is yielding a positive return, you’re validating the strategy you’ve activated. If an ad isn't working, stop paying for it. If a new product launch isn't selling as well as expected, tweak the strategy so that it sells better and adapt to demand—just like the big brands do.
How are big brands leveraging ecommerce analytics?
You can use data to develop products that will outsell the products of your competitors. Walmart is a company landing big wins by prioritizing the data edge.
Walmart processes almost three petabytes of data an hour; that’s right, three petabytes. For context, one petabyte is equivalent to 20 million filing cabinets. Remember filing cabinets? Walmart is the poster child for big data analytics for supply chain management, inventory, and pricing. They have 200 active streams of transactional automation happening at any given minute, but it’s ok to aim lower if you’re just getting acquainted with enhanced analytics. Just starting puts you ahead of the pack.
How do I optimize my product lineup?
When you look at your data, you'll be able to see products objectively, meaning you’ll immediately see what’s performing well and what isn’t. Your data dashboard should be the HQ for strategic inventory and pricing decisions.
Leaning on <Cart.com’s artificial intelligence (AI) and predictive modeling> takes reactivity and impulsive decision-making out of the equation. Smart analytics platforms, like Cart.com’s, analyze the trends often invisible to humans, like the granular micro shifts in price and imagery that happen every second across platforms.
When businesses start using the data they have and let predictive modeling handle the data entry and manual updates, brands flourish. And it’s all about incremental gains. You aren’t going to be running 200 active transactional streams by the end of the quarter, but you’ll see those small winds turn into huge wins over time.
What is opportunity modeling?
Opportunity models address the uniqueness of events or actions and the business edge they present. It’s basically automated SWOT (strengths, weaknesses, opportunities and threats) analysis for the marketers in the room.
For example, If someone buys an item from your store, you could send an email suggesting related products that could also interest them. This would encourage people who have already shown an interest in one of your products to buy more from other sections of your site as well.
Similarly, you can use these models to sell your customers additional products or features that relate to what they've already bought.
Enhance marketing campaigns
How your customers shop, what they're looking for, and how they interact with your products can help you make more informed decisions about the future of your brand.
By analyzing user behavior data, you can learn what content resonates with your audience and craft more effective marketing campaigns. You'll also be able to see which channels are working best for you so you can focus on optimizing those instead of wasting time on ones that aren't productive.
- Create a personalized user experience for your customers
Personalization is a key factor for driving a great user experience, and it’s one of the ways brands improve online stores. Tailor product recommendations by using the data you have about your customers’ behavior in order to recommend the products they’re most likely to purchase.
Analytics can also help you figure out what products are most popular and how much they should cost. You can fully optimize your product pages, allowing them to rank higher in search engines and boost your sales.
- Understand what customers are responding to
When you know what your customers are doing, you can use this information to make changes that will improve the experience for everyone. For example, if a customer is frequently visiting the same product page but not buying anything, maybe they're confused by the product description. You could change the description to make it easier to understand and more accurate, or even just update it so that it's more representative of the current version of your product.
- Manage inventory efficiently and conservatively
When you use enhanced ecommerce analytics, it's easy to get overwhelmed by all the data available to you. But, it’s there for you, not a physicist or a statistician with a data-science degree. Stop leaving revenue on the table—because popular products are out of stock and unpopular products are piling up in the corner of the warehouse, or eating up your advertising budget. Use your data to proactively address the black holes that cripple so many new ecommerce brands.
5 Parting tips for leveling up your brand’s analytics capabilities:
All the data in the world won't help you if you hide from it. Here are some best practices that can help reduce data anxiety and make data storytelling easier:
- Nurture a data-driven culture
Your team needs access to all the information relating to their area of responsibility so that they can make informed decisions and work together toward common goals. Sharing this information helps with communication between departments.
You can also improve your analytics capabilities by looking at your organization's culture, as a company's culture can impact, well everything. Getting people engaged with data analysis starts with communicating value and championing their input. Letting them participate in the dialogue is key.
- Unify your marketing efforts
You can't make informed decisions about your business if you don't have visibility into your brand and your products at large. The data you collect from analytics influences every aspect of your marketing, from how much money to spend on paid advertising to knowing which features to build into your product. It can take a little internal marketing, but emphasizing the value you put in data-driven decisions is very important.
- Understand what patterns look like
A mountain of data is useless if traffic spikes and incremental losses don’t stand out when you see them. There are always patterns and trends in the data, and they “look” a certain way. Get comfortable with those visualization queues.
- Connect the data with the people it represents, your customers
The only way to understand your data is when you align it with customer behavior. Understanding where they're coming from, and what they're looking for when they visit your store makes for a better experience and ultimately a better brand. You can take the patterns you see and apply them to three
- Website design
- Multi-channel marketplace management
- Inventory optimization
- Advertising feed management
- Automate Data Collection
Automation is the key to a seamless customer experience. Use it to collect and catalog actionable insights into your customer behavior, which can in turn help you make better business decisions. You can automate various aspects of the ecommerce analytics dashboard to quickly produce valuable customer insight data.
Automation is not just about saving time — it’s about making your business more agile and efficient. In the ecommerce space, automation gives you the ability to collect data on the fly and analyze it in real-time. You don’t have to manually check each and every report every day or week; simply rely on automated tools to do the work for you.
Some popular connectors and integrations Cart.com’s Unified Analytics pairs with:
.png)
The Bottom Line
Smart data is here. Love it or leave it. It informs every aspect of our lives. Whether you're shopping at the grocery store, browsing a job board, or using Facebook to connect with friends, you're bound to uncover some sort of data. ecommerce analytics is no different.
Ecommerce analytics come in all shapes and sizes, but they all have one purpose in common: to give brands selling products online more information about the behavior of their customers.
Brands willing to proactively leverage the power will consistently increase profit margins, better manage SKUs, and win the coveted buy box in those big, competitive marketplaces. Analytics can help them uncover actionable insights about their customers and which marketing tactics are working. Armed with that knowledge, you can create more effective campaigns, increase sales, and create stronger brands.